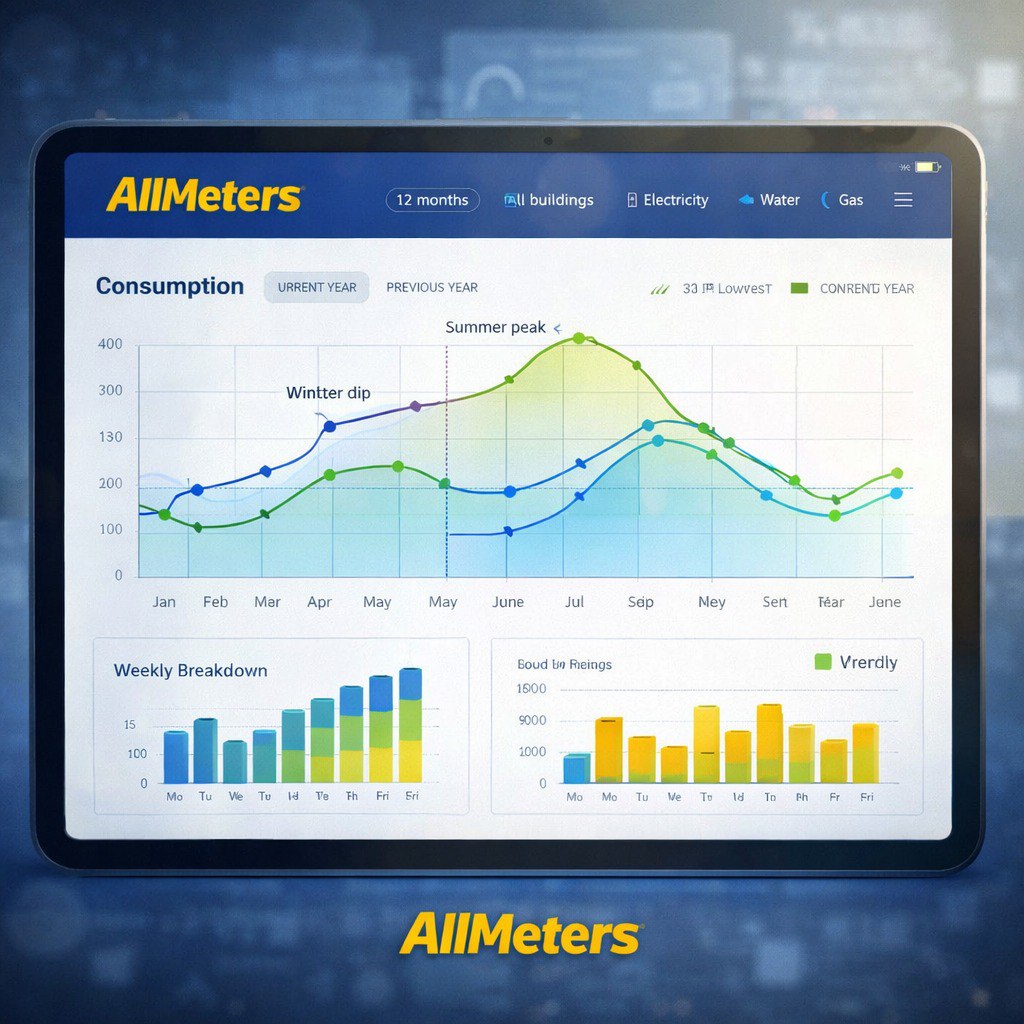
📈 Understand your consumption with interactive charts!
📅 Weekly, monthly, yearly
🔄 Year-over-year comparisons
🎯 Consumption pattern identification
Knowledge = Savings! 💡💰
Analyze intelligently 👉 www.all-meters.com
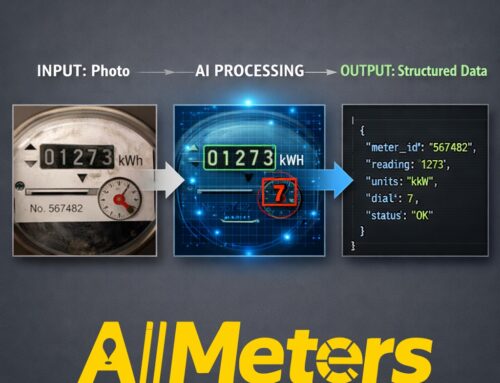
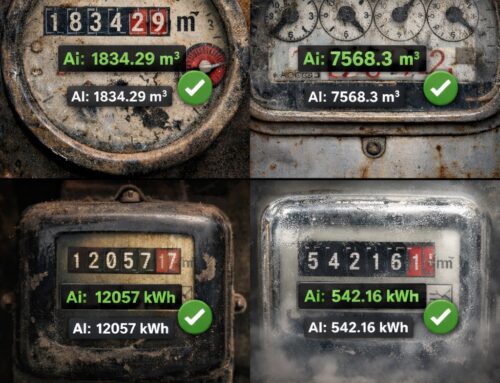
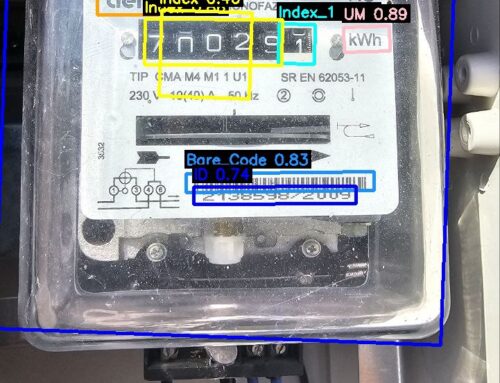
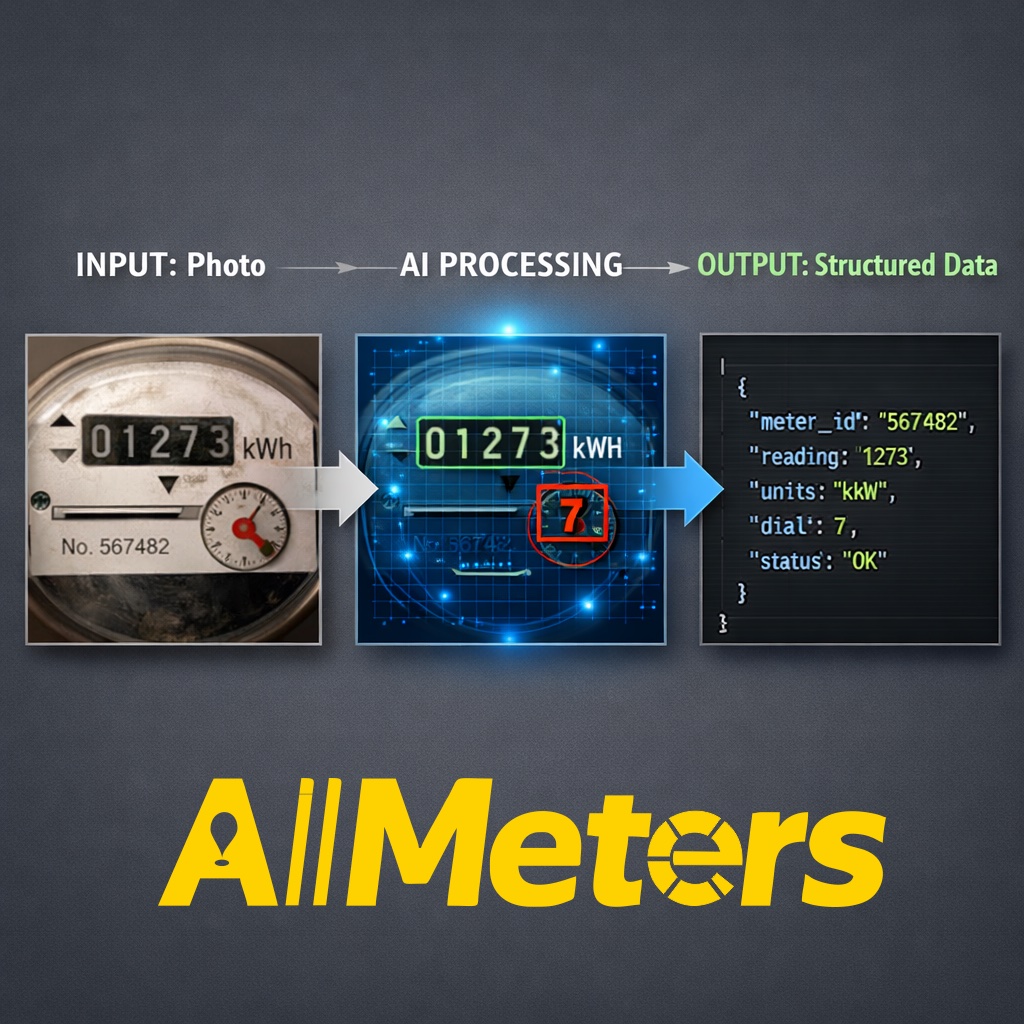
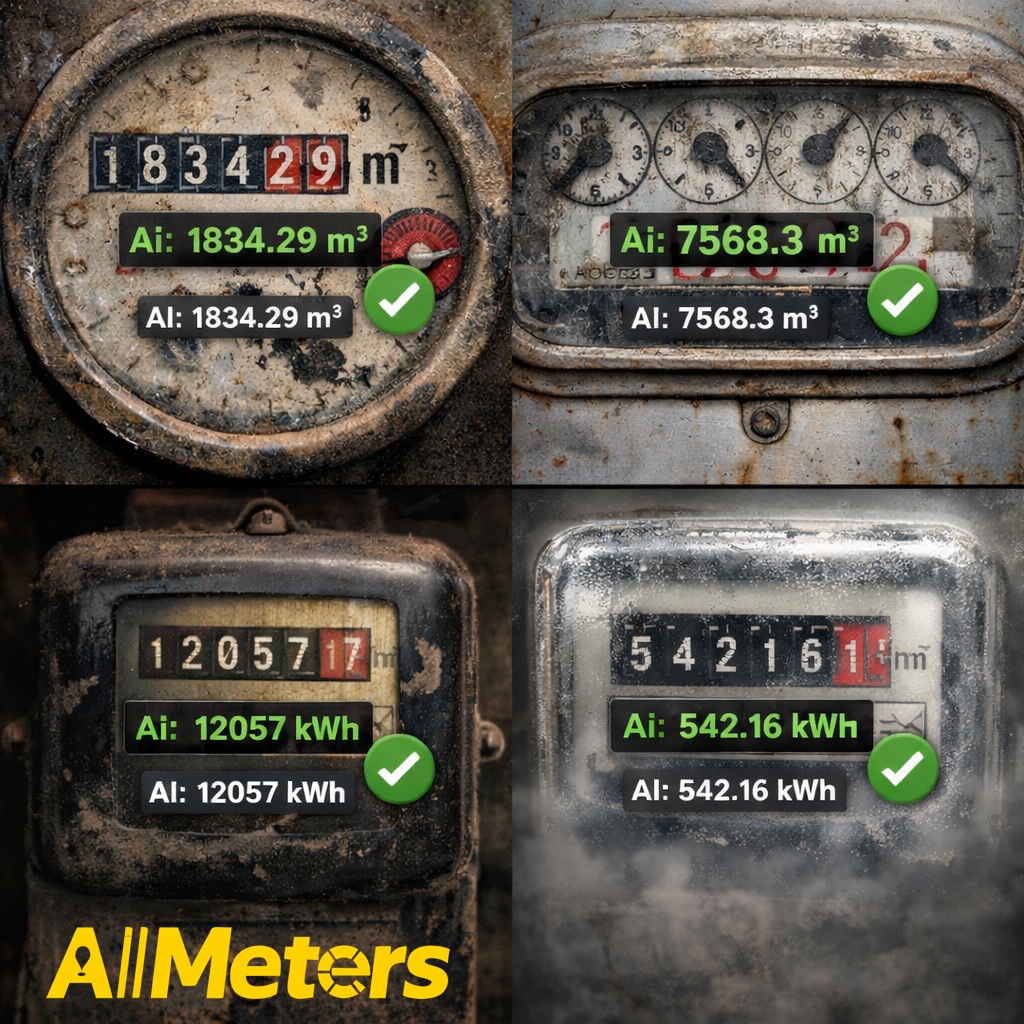
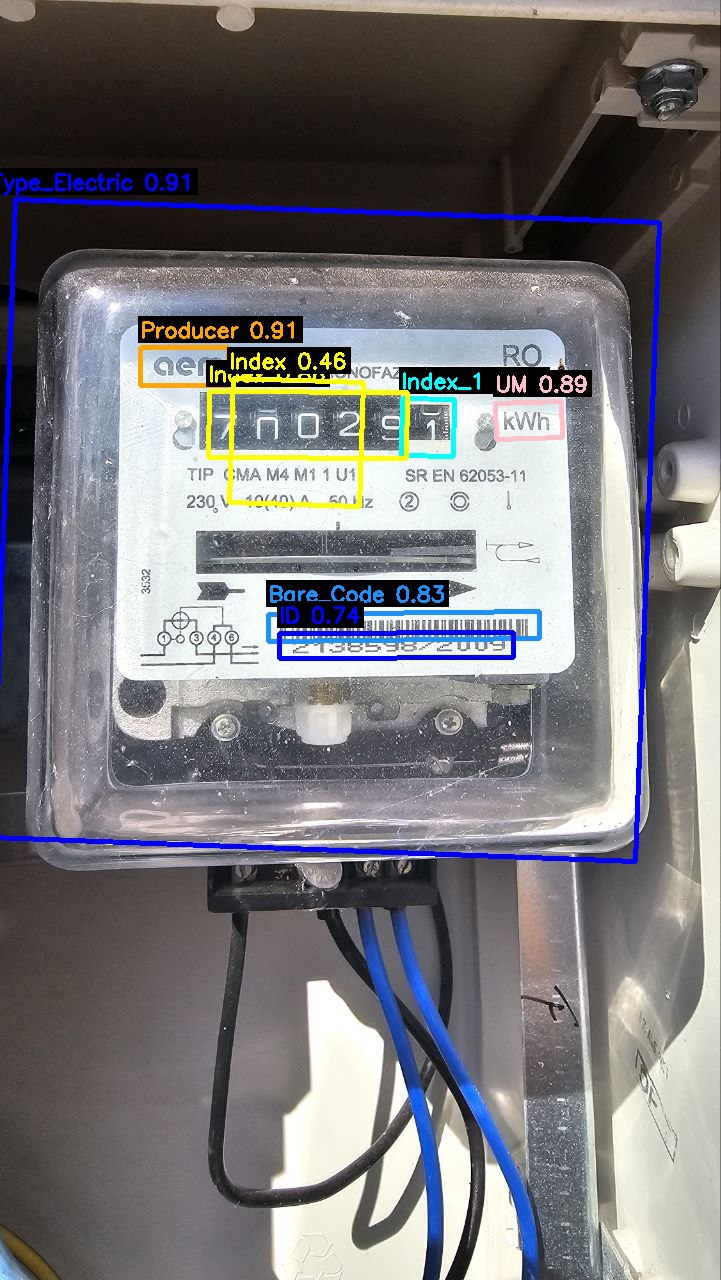
🤖 AllMeters uses AI throughout our stack: meter detection, chatbots, and social media visuals.
This image was created with AI to illustrate our vision.
#AllMeters #DataAnalytics #ConsumptionTrends #SmartGraphs #InsightsAI #DataDriven #EnergyAwareness


Leave A Comment
You must be logged in to post a comment.