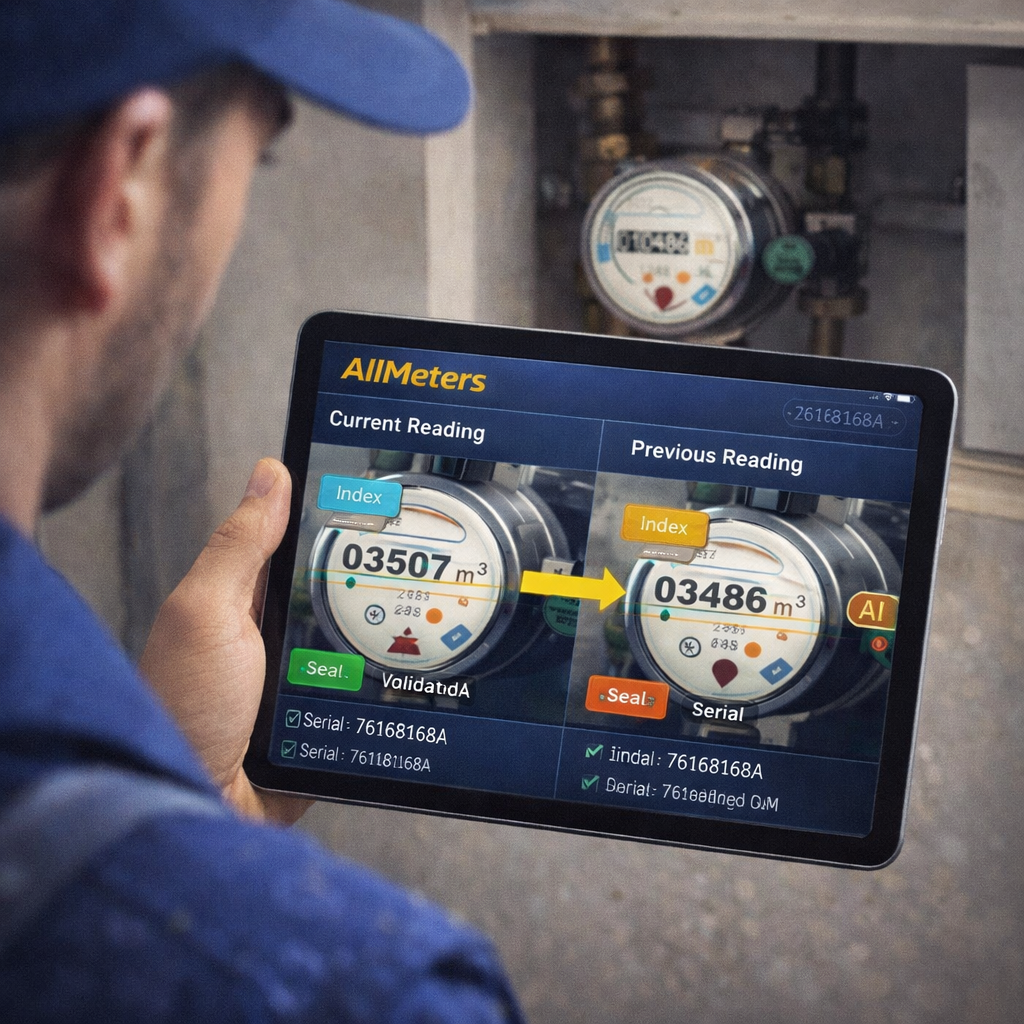
How AllMeters Gives Field Readers Complete Meter History
One of the most costly inefficiencies in utility field operations is the re-visit: a meter reader arrives at a location, finds a discrepancy between the current reading and billing records, but has no historical data available to resolve it on the spot. The result is a manual process — the reader logs the discrepancy, returns to the office, a supervisor pulls the paper archive, a callback is scheduled — adding days of delay and significant labor cost to a single billing cycle.
AllMeters eliminates re-visits by giving every field reader 24 months of verified reading history directly on their mobile device. This post explains how the history system works, what data it contains, and how it integrates with the route optimization and dispute resolution workflows.
What the Field Reader Sees
When a field reader opens the AllMeters app and selects a meter on their assigned route, the meter detail screen displays:
- Last 24 readings: Index values with timestamps, flagged if they were manual overrides or AI-extracted
- Consumption trend: A 12-month consumption chart showing average usage, peak months, and anomalies
- Previous visit photos: The actual meter photographs from the last 12 readings, browsable with timestamps
- Active flags: Any open dispute, anomaly alert, or seal concern from previous visits
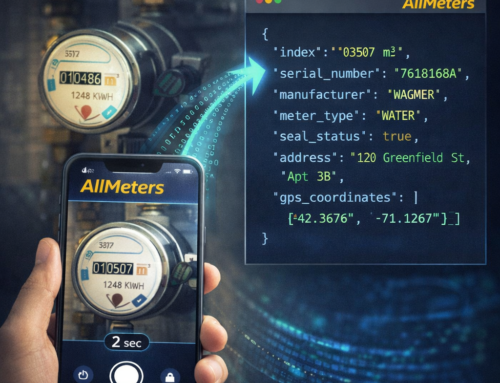
- Meter ID history: Serial number, manufacturer, seal verification status from each visit
- GPS-tagged visit log: Confirmed arrival times at the meter location with GPS coordinates
All of this data loads offline — the reader’s device synchronizes the route package (including history for all assigned meters) before leaving the office. Field operations in areas with poor mobile signal are fully supported.
Dispute Resolution on the First Visit
The most common disputes in meter reading involve clients claiming that the reading was taken incorrectly, that the meter was accessed without their presence, or that the billed consumption is inconsistent with actual usage. AllMeters provides three layers of evidence that resolve most disputes before a formal complaint is filed:
1. Timestamped Photographs
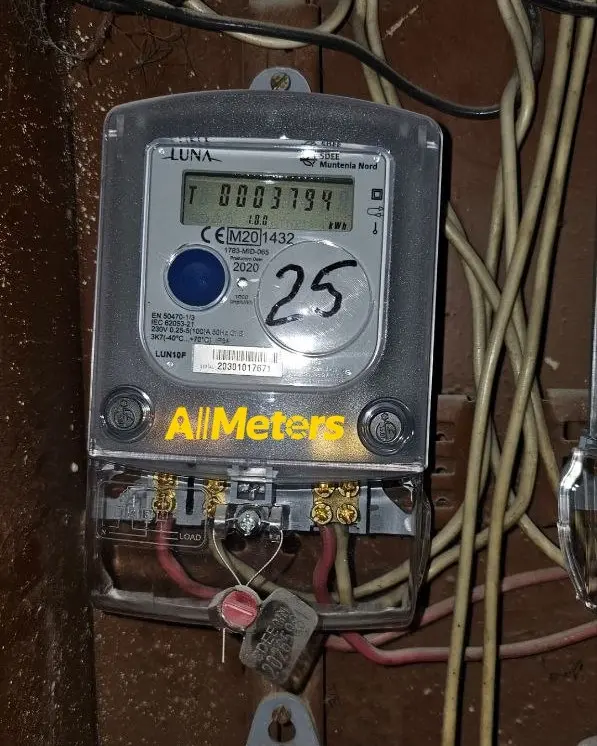
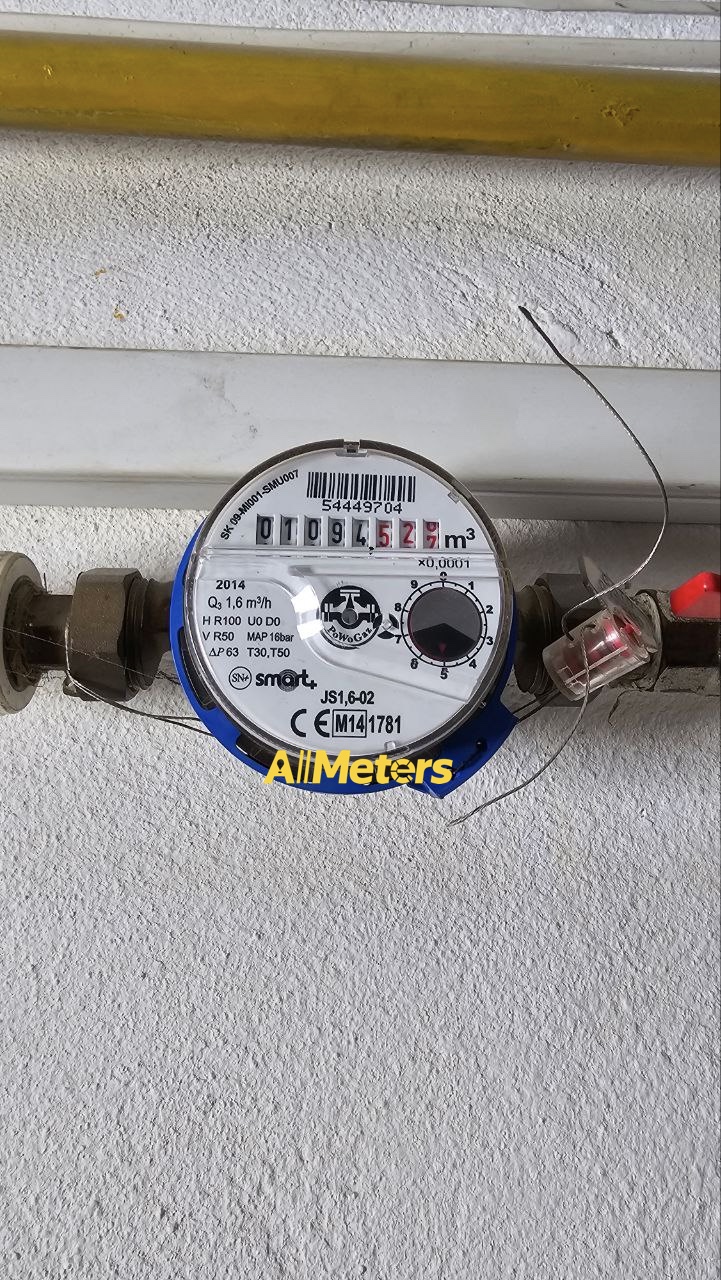
Every reading captured through AllMeters is accompanied by the original meter photograph with a cryptographic timestamp. The photograph shows the meter display, the seal status, and the meter’s physical condition at the moment of reading. Clients who contest a reading can be shown the photograph immediately — either by the field reader on their device or through the client-facing transparency portal.
2. GPS-Verified Presence
The AllMeters mobile app records GPS coordinates at the moment a reading is captured. The GPS log confirms that the field reader was physically at the meter location. For meters inside buildings, the system uses a combination of GPS and WiFi triangulation to verify proximity within 15 meters. GPS verification is logged server-side and cannot be altered by the field reader.
3. Consumption Anomaly Flagging
The AllMeters AI compares each new reading against the 24-month consumption baseline for that meter. If the new reading implies consumption that is more than 2.5 standard deviations from the historical average, an anomaly flag is raised before the reading is accepted. The field reader receives a prompt: “This reading implies 340% higher consumption than average. Confirm or retake photo?” This prevents accidental entry of incorrect index values at the point of collection, rather than after the billing cycle has been processed.
Route Optimization with Historical Context
AllMeters generates optimized daily reading routes for each field reader based on geographic clustering and historical visit timing. The route optimization engine factors in:
- Geographic proximity: Meters are clustered to minimize travel distance between consecutive readings
- Access windows: Meters that require resident presence are scheduled during the time windows from previous successful visits
- Outstanding flags: Meters with open disputes or failed readings from the previous cycle are prioritized and grouped
- Seasonal patterns: Routes account for seasonal access constraints (e.g., summer cottage meters, basement meters accessible only in certain months)
In production deployments, AllMeters route optimization increases daily meter throughput from 50 meters per reader (standard paper-based routing) to 150 meters per reader — a 3× improvement. The primary driver is the elimination of backtracking and of re-visits that can no longer be pre-empted by accessing historical data in the field.
Data Retention and GDPR Compliance
AllMeters stores reading history (index values, timestamps, GPS coordinates, photographs) for 24 months per meter, consistent with Romanian utility billing dispute resolution windows. After 24 months, historical records are automatically archived according to the data retention policy agreed with each utility provider.
Reading photographs and GPS logs are stored at the utility provider’s own infrastructure — Google Drive, OneDrive, S3, or NAS — not at AllMeters. AllMeters stores only metadata (reading timestamps, index values, confidence scores, flags). This architecture means the utility provider remains the data controller under GDPR, and AllMeters functions as a data processor. No meter reading data or customer photographs are hosted on AllMeters servers.
Integration with Utility Billing Systems
Field history data is accessible via the AllMeters REST API at the GET /v1/meters/{meter_id}/history endpoint. The response includes all readings for the specified meter within a date range, with full metadata. Billing systems can pull verified reading history programmatically for dispute resolution workflows, regulatory reporting, or consumption analysis.
For utility providers integrating AllMeters into existing field management platforms, a dedicated webhook delivers new reading data in real time — no polling required. Contact contact@all-meters.com for integration support and custom SLA terms.
👉 www.all-meters.com



Leave A Comment
You must be logged in to post a comment.